
Wavefront & Prometheus & Filebeat
업데이트:
Wavefront & Prometheus & Filebeat
고객사에서 Tanzu Observability를 활용하여 Kubernetes Cluster에 반영한 MSA 11개 apps 모니터링 요청.
- monitroing : tanzu observability
- metric : prometheus
- log : filebeat
- sample app : MSA Sample Apps Boutique
Tanzu Observability & Wavefront
- TO에서 wavefront를 integration하여 k8s cluster에 설치할 수 있음.
- filebeat 연동을 해야하나, k8s에 설치되는 wavefront pod에는 filebeat 설정을 추가할 수 없음.
- 자세한 설정에 대해서는 to팀 확인 필요.
- 따라서, wavefront는 vm에 설치
Install Wavefront
- Wavefront 설치 방법은 다음과 같다.
- TMC에서 Intergration하는 방식은 제외.
Kubernetes Cluster
-
Helm Repo Add
$ helm repo add wavefront https://wavefronthq.github.io/helm/ && helm repo update -
Install
- helm chart를 받아서 values.yaml을 수정
$ helm pull wavefront/wavefront-
pull 받은 wavefront-1.10.1.tgz 파일 압축 해제 후 values.yaml 수정
  $ kubectl create ns wavefront
  $ helm install wavefront -n wavefront -f ./values.yaml .
-
-
online 설치
kubectl create namespace wavefront && helm install wavefront wavefront/wavefront \
  --set wavefront.url=https://<wavefront url> \
  --set wavefront.token=<wavefront token> \
  --set clusterName=<cluster name> --namespace wavefront \
  --set proxy.traceJaegerApplicationName="Boutique" \
  --set proxy.jaegerPort=30001 \
  --set proxy.replicas=3 \
  --set proxy.traceJaegerHttpListenerPort=30080 \
  --set proxy.replicas=3
- helm chart를 받아서 values.yaml을 수정
VM or Baremetal
ubuntu 20.04 기준으로 작성되었으며, apt를 사용하여 설치.
-
Install
$ curl -s https://packagecloud.io/install/repositories/wavefront/proxy/script.deb.sh | sudo bash $ sudo apt-get install wavefront-proxy=11.0-1- 참고 : wavefront
- 설치하면 /etc/wavefront에 wavefront-proxy 디렉토리가 생성됨.
-
wavefront.conf 설정
$ vi /etc/wavefront/wavefront-proxy/wavefront.conf ... server=https://<wavefront url>/api/ hostname=<hostname or kubernetes cluster name> token=<wavefront token> ... ... ###### LOGS TO METRICS SETTINGS ##### filebeatPort=5044 rawLogsPort=5045 rawLogsMaxReceivedLength=4096 rawLogsHttpBufferSize=16777216 logsIngestionConfigFile=/etc/wavefront/wavefront-proxy/logsingestion.yaml ...- filebeat 연동을 위해 관련된 설정을 수정.
-
filebeat 연동을 위해 logingestion.yaml 생성
counters: - pattern: '%{COMBINEDAPACHELOG}' metricName: 'kubernetes_log_lines' - pattern: 'quantity=%{NUMBER:count}' valueLabel: 'count' metricName: 'cartService' - pattern: '%{IPORHOST:[clientip]} - \[%{HTTPDATE:[timestamp]}\] \"%{WORD:[method]} %{DATA:[request]} HTTP/%{NUMBER:[http_version]}\" %{NUMBER:[response]} (?:%{NUMBER:[bytes]}|-)( \"%{DATA:[referrer]}\")( \"%{DATA:[agent]}\")' metricName: 'nginx_log_lines' gauges: - pattern: '%{IPORHOST:[clientip]} - \[%{HTTPDATE:[timestamp]}\] \"%{WORD:[method]} %{DATA:[request]} HTTP/%{NUMBER:[http_version]}\" %{NUMBER:[response]} (?:%{NUMBER:[bytes]}|-)( \"%{DATA:[referrer]}\")( \"%{DATA:[agent]}\")' valueLabel: '[response]' metricName: 'nginxStatus' - pattern: 'quantity=%{NUMBER:count}' valueLabel: 'count' metricName: 'cartServiceGauge' histograms: - pattern: '%{IPORHOST:[clientip]} - \[%{HTTPDATE:[timestamp]}\] \"%{WORD:[method]} %{DATA:[request]} HTTP/%{NUMBER:[http_version]}\" %{NUMBER:[response]} (?:%{NUMBER:[bytes]}|-)( \"%{DATA:[referrer]}\")( \"%{DATA:[agent]}\")' metricName: 'responseBytes' valueLabel: '[bytes]' - pattern: 'quantity=%{NUMBER:count}' valueLabel: 'count' metricName: 'cartServiceHistogram'- nginx ingress와 boutique 정보를 가져오기 위해 2종류의 pattern 설정
-
wavefront start & stop
 $ service wavefront-proxy start
 $ tail -f /var/log/wavefront/wavefront.log
 2022-04-20 14:36:03,240 INFO  [proxy:parseArguments] Wavefront Proxy version 11.0 (pkg:linux_rpm_deb), runtime: OpenJDK Runtime Environment (Azul Systems, Inc.) 11.0.9
 2022-04-20 14:36:03,245 INFO  [proxy:parseArguments] Arguments: -f /etc/wavefront/wavefront-proxy/wavefront.conf
 2022-04-20 14:36:03,264 INFO  [ProxyConfig:verifyAndInit] Loaded configuration file /etc/wavefront/wavefront-proxy/wavefront.conf
 2022-04-20 14:36:03,280 INFO  [proxy:getOrCreateProxyId] Ephemeral proxy id created: e5f9a97a-df4d-48fe-ba59-b8d4dae1d6be
 2022-04-20 14:36:03,672 INFO  [proxy:checkin] Checking in tenants: https://sentosa.wavefront.com/api/
 2022-04-20 14:36:04,530 INFO  [proxy:<init>] initial configuration is available, setting up proxy
 2022-04-20 14:36:04,636 INFO  [proxy:scheduleCheckins] scheduling regular check-ins
 2022-04-20 14:36:04,839 INFO  [proxy:lambda$startListeners$7] listening on port: 2878 for Wavefront metrics
 2022-04-20 14:36:04,869 INFO  [proxy:startJsonListener] listening on port: 3878 for JSON metrics data
 2022-04-20 14:36:04,898 INFO  [proxy:startWriteHttpJsonListener] listening on port: 4878 for write_http data
 2022-04-20 14:36:04,934 INFO  [proxy:startListeners] Initializing logs ingestion
 2022-04-20 14:36:05,061 INFO  [proxy:startLogsIngestionListener] listening on port: 5044 for Filebeat logs
 2022-04-20 14:36:05,065 INFO  [proxy:startRawLogsIngestionListener] listening on port: 5045 for raw logs
 2022-04-20 14:36:05,071 INFO  [Server:listen] Starting server on port: 5044
 2022-04-20 14:36:08,051 INFO  [LogsIngester:onNewConnection] New filebeat connection.
 2022-04-20 14:36:08,057 INFO  [LogsIngester:onNewConnection] New filebeat connection.
 2022-04-20 14:36:08,058 INFO  [LogsIngester:onNewConnection] New filebeat connection.
 2022-04-20 14:36:08,060 INFO  [LogsIngester:onNewConnection] New filebeat connection.
 2022-04-20 14:36:08,081 INFO  [LogsIngester:onConnectionClose] Filebeat connection closed.
 2022-04-20 14:36:08,081 INFO  [LogsIngester:onConnectionClose] Filebeat connection closed.
 2022-04-20 14:36:08,081 INFO  [LogsIngester:onConnectionClose] Filebeat connection closed.
 2022-04-20 14:36:08,083 INFO  [LogsIngester:onConnectionClose] Filebeat connection closed.
 ...
 ...

 $ service wavefront-proxy stop
 $ tail -f /var/log/wavefront/wavefront.log
 2022-04-20 14:34:43,401 INFO  [AbstractReportableEntityHandler:printStats] [2878] Points received rate: 0 pps (1 min), 0 pps (5 min), 0 pps (current).
 2022-04-20 14:34:43,461 INFO  [AbstractReportableEntityHandler:printStats] [3878] Points received rate: 0 pps (1 min), 0 pps (5 min), 0 pps (current).
 2022-04-20 14:34:43,482 INFO  [AbstractReportableEntityHandler:printStats] [4878] Points received rate: 0 pps (1 min), 0 pps (5 min), 0 pps (current).
 2022-04-20 14:34:43,668 INFO  [AbstractReportableEntityHandler:printTotal] [logs-ingester] Points processed since start: 0; blocked: 0
 2022-04-20 14:34:43,668 INFO  [AbstractReportableEntityHandler:printStats] [logs-ingester] Points received rate: 0 pps (1 min), 0 pps (5 min), 0 pps (current).
 2022-04-20 14:34:47,947 INFO  [LogsIngester:onNewConnection] New filebeat connection.
 2022-04-20 14:34:47,947 INFO  [LogsIngester:onNewConnection] New filebeat connection.
 2022-04-20 14:34:47,947 INFO  [LogsIngester:onNewConnection] New filebeat connection.
 2022-04-20 14:34:47,948 INFO  [LogsIngester:onNewConnection] New filebeat connection.
 2022-04-20 14:34:47,951 INFO  [LogsIngester:onConnectionClose] Filebeat connection closed.
 2022-04-20 14:34:47,951 INFO  [LogsIngester:onConnectionClose] Filebeat connection closed.
 2022-04-20 14:34:47,952 INFO  [LogsIngester:onConnectionClose] Filebeat connection closed.
 2022-04-20 14:34:47,953 INFO  [LogsIngester:onConnectionClose] Filebeat connection closed.
 2022-04-20 14:34:52,992 INFO  [proxy:shutdown] Shutting down the proxy...
 2022-04-20 14:34:53,027 INFO  [TcpIngester:run] Listener on port 4878 shut down
 2022-04-20 14:34:53,037 INFO  [TcpIngester:run] Listener on port 5045 shut down
 2022-04-20 14:34:53,044 INFO  [TcpIngester:run] Listener on port 2878 shut down
 2022-04-20 14:34:53,072 INFO  [TcpIngester:run] Listener on port 3878 shut down
 2022-04-20 14:34:53,101 INFO  [LogsIngester:onConnectionClose] Filebeat connection closed.
 2022-04-20 14:34:53,106 INFO  [LogsIngester:onConnectionClose] Filebeat connection closed.
 2022-04-20 14:34:55,217 INFO  [proxy:lambda$startLogsIngestionListener$57] Filebeat server on port 5044 shut down
 ...
 ...
Install Filebeat
helm chart로 k8s cluster에 설치.
-
Helm Repo Add
$ helm repo add elastic https://helm.elastic.co -
Install
-
helm chart를 받아서 values.yaml을 수정
$ helm pull elastic/filebeat -
pull 받은 filebeat-7.17.1.tgz 파일 압축 해제 후 values.yaml 수정
$ vi values.yaml ... filebeatConfig: filebeat.yml: | filebeat.inputs: - type: container #tags: ["json"] paths: - /var/log/containers/*.log processors: - add_kubernetes_metadata: host: ${NODE_NAME} matchers: - logs_path: logs_path: "/var/log/containers/" output.logstash: hosts: "<wavefront proxy fqdn or ip>:5044" ... -
helm install
$ kubectl create ns filebeat $ helm install filebeat -n filebeat -f ./values.yaml . -
설치 확인
  NAME                          READY   STATUS    RESTARTS   AGE
  pod/filebeat-filebeat-nj6cr   1/1     Running   0          38h
  pod/filebeat-filebeat-rkm5h   1/1     Running   0          38h

  NAME                               DESIRED   CURRENT   READY   UP-TO-DATE   AVAILABLE   NODE SELECTOR   AGE
  daemonset.apps/filebeat-filebeat   2         2         2       2            2           <none>          38h
-
Install Wavefront-Proxy & Adapter & Prometheus
kubernetes cluster에서 실행중인 prometheus에서 metric 수집하기 위해 wavefront-proxy, adapter, prometheus 설치.
Install wavefront-proxy
- wavefront-proxy 배포
- 아래 wavefront.yaml 생성 후 배포
- WAVEFRONT_URL, WAVEFRONT_TOKEN 정보 수정
-
k apply -f ./wavefront.yaml
# Need to change YOUR_CLUSTER and YOUR_API_TOKEN accordingly
apiVersion: apps/v1
# Kubernetes versions after 1.9.0 should use apps/v1
# Kubernetes version 1.8.x should use apps/v1beta2
# Kubernetes versions before 1.8.0 should use apps/v1beta1
kind: Deployment
metadata:
  labels:
    app: wavefront-proxy
    name: wavefront-proxy
  name: wavefront-proxy
  namespace: default
spec:
  replicas: 1
  selector:
    matchLabels:
      app: wavefront-proxy
  template:
    metadata:
      labels:
        app: wavefront-proxy
    spec:
      containers:
        - name: wavefront-proxy
          image: projects.registry.vmware.com/tanzu_observability/proxy:11.0
          imagePullPolicy: IfNotPresent
          env:
            - name: WAVEFRONT_URL
              value: https://<wavefront url>/api/
            - name: WAVEFRONT_TOKEN
              value: <wavefront token>
          # Uncomment the below lines to consume Zipkin/Istio traces
          #- name: WAVEFRONT_PROXY_ARGS
          #  value: --traceZipkinListenerPorts 9411
          ports:
            - containerPort: 2878
              protocol: TCP
          # Uncomment the below lines to consume Zipkin/Istio traces
          #- containerPort: 9411
          #  protocol: TCP
          securityContext:
            privileged: false
---
apiVersion: v1
kind: Service
metadata:
  name: wavefront-proxy
  labels:
    app: wavefront-proxy
  namespace: default
spec:
  ports:
    - name: wavefront
      port: 2878
      protocol: TCP
  # Uncomment the below lines to consume Zipkin/Istio traces
  #- name: http
  #  port: 9411
  #  targetPort: 9411
  #  protocol: TCP
  selector:
    app: wavefront-proxy
-
설치 확인
 k get deployment,pod,svc -n default
 NAME                                         READY   UP-TO-DATE   AVAILABLE   AGE
 deployment.apps/wavefront-proxy              1/1     1            1           2d2h

 NAME                                             READY   STATUS    RESTARTS   AGE
 pod/wavefront-proxy-6c4b4d45b6-qfrf6             1/1     Running   0          2d2h

 NAME                              TYPE        CLUSTER-IP       EXTERNAL-IP   PORT(S)                      AGE
 service/wavefront-proxy           ClusterIP   10.107.101.130   <none>        2878/TCP                     2d2h
Install wavefront prometheus storage adapter
storage adapter는 fork 역할을 하여 데이터를 wavefront로 전달.
-
storage adapter 배포
- 아래 adapter.yaml 생성 후 배포
- -proxy, -prefix 수정
-
k apply -f ./adapter.yaml
kind: Deployment
apiVersion: apps/v1
metadata:
  name: prometheus-storage-adapter
  namespace: default
spec:
  replicas: 1
  selector:
    matchLabels:
      app: prometheus-storage-adapter
  template:
    metadata:
      labels:
        app: prometheus-storage-adapter
    spec:
      containers:
      - name: prometheus-storage-adapter
        image: wavefronthq/prometheus-storage-adapter:latest
        command:
        - /bin/adapter
        - -listen=1234
        - -proxy=wavefront-proxy.default.svc.cluster.local
        - -proxy-port=2878
        - -prefix=wavefront
---
apiVersion: v1
kind: Service
metadata:
  name: storage-adapter-service
spec:
  selector:
    app: prometheus-storage-adapter
  ports:
    - name: adapter-port
      protocol: TCP
      port: 80
      targetPort: 1234
-
설치 확인
 k get deployment,pod,svc -n default
 NAME                                         READY   UP-TO-DATE   AVAILABLE   AGE
 deployment.apps/prometheus-storage-adapter   1/1     1            1           4d22h

 NAME                                             READY   STATUS    RESTARTS   AGE
 pod/wavefront-proxy-6c4b4d45b6-qfrf6             1/1     Running   0          2d2h

 NAME                              TYPE        CLUSTER-IP       EXTERNAL-IP   PORT(S)                      AGE
 service/storage-adapter-service   ClusterIP   10.101.190.141   <none>        80/TCP                       4d22h
Install Prometheus
-
Helm Repo Add
$ helm repo add elastic https://helm.elastic.co -
Install
-
helm chart를 받아서 values.yaml을 수정
$ helm pull prometheus-community/prometheus -
pull 받은 prometheus-15.8.1.tgz 파일 압축 해제 후 values.yaml 수정
$ vi values.yaml ... remoteWrite: - url: "http://storage-adapter-service.default.svc.cluster.local/receive" ... - storage adapter를 prometheus와 통합하려면 remoteWrite 추가
-
helm install
$ kubectl create ns prometheus $ helm install prometheus -n prometheus -f ./values.yaml . -
설치 확인
  $ k get all -n prometheus
  NAME                                                 READY   STATUS    RESTARTS   AGE
  pod/prometheus-alertmanager-87bd747b4-bz9c7          2/2     Running   0          4d22h
  pod/prometheus-kube-state-metrics-5fd8648d78-5wz8c   1/1     Running   0          4d22h
  pod/prometheus-node-exporter-2t7kh                   1/1     Running   0          4d22h
  pod/prometheus-node-exporter-pqpss                   1/1     Running   0          4d22h
  pod/prometheus-pushgateway-fd65767c7-sfhhk           1/1     Running   0          4d22h
  pod/prometheus-server-6c55d96794-qg678               2/2     Running   0          4d22h

  NAME                                    TYPE        CLUSTER-IP       EXTERNAL-IP   PORT(S)    AGE
  service/prometheus-alertmanager         ClusterIP   10.104.118.115   <none>        80/TCP     4d22h
  service/prometheus-kube-state-metrics   ClusterIP   10.108.224.119   <none>        8080/TCP   4d22h
  service/prometheus-node-exporter        ClusterIP   None             <none>        9100/TCP   4d22h
  service/prometheus-pushgateway          ClusterIP   10.96.68.63      <none>        9091/TCP   4d22h
  service/prometheus-server               ClusterIP   10.109.181.44    <none>        80/TCP     4d22h

  NAME                                      DESIRED   CURRENT   READY   UP-TO-DATE   AVAILABLE   NODE SELECTOR   AGE
  daemonset.apps/prometheus-node-exporter   2         2         2       2            2           <none>          4d22h

  NAME                                            READY   UP-TO-DATE   AVAILABLE   AGE
  deployment.apps/prometheus-alertmanager         1/1     1            1           4d22h
  deployment.apps/prometheus-kube-state-metrics   1/1     1            1           4d22h
  deployment.apps/prometheus-pushgateway          1/1     1            1           4d22h
  deployment.apps/prometheus-server               1/1     1            1           4d22h

  NAME                                                       DESIRED   CURRENT   READY   AGE
  replicaset.apps/prometheus-alertmanager-87bd747b4          1         1         1       4d22h
  replicaset.apps/prometheus-kube-state-metrics-5fd8648d78   1         1         1       4d22h
  replicaset.apps/prometheus-pushgateway-fd65767c7           1         1         1       4d22h
  replicaset.apps/prometheus-server-6c55d96794               1         1         1       4d22h
-
Tanzu Observability Dashboard 확인
-
위의 설정을 하면 filebeat에서 발생한 로그의 metric을 TO Metrics에서 확인 가능.
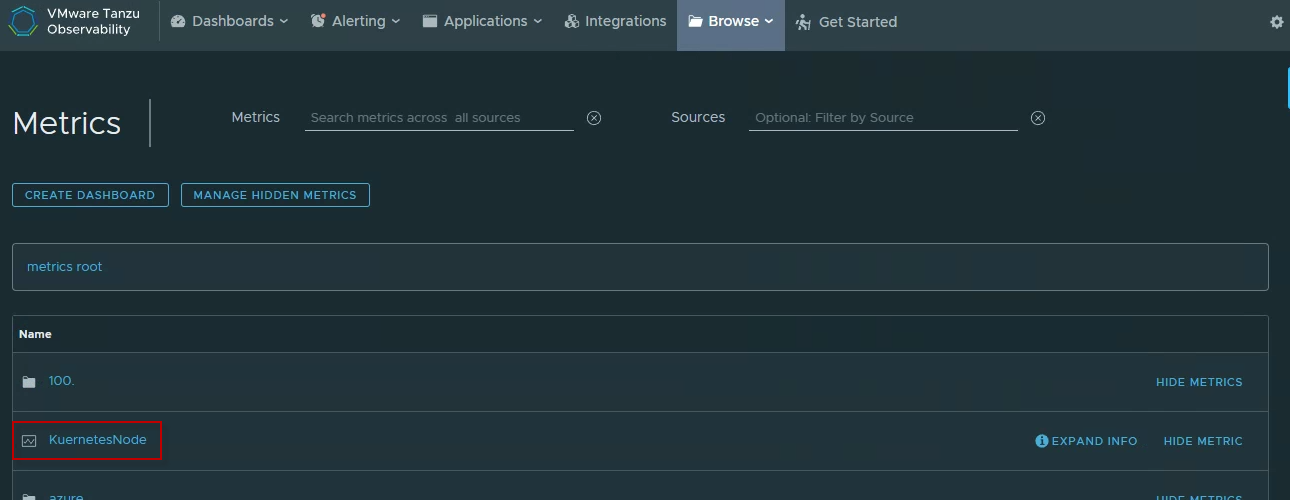
-
수집된 metric을 기반으로 chart를 생성할 수 있음.
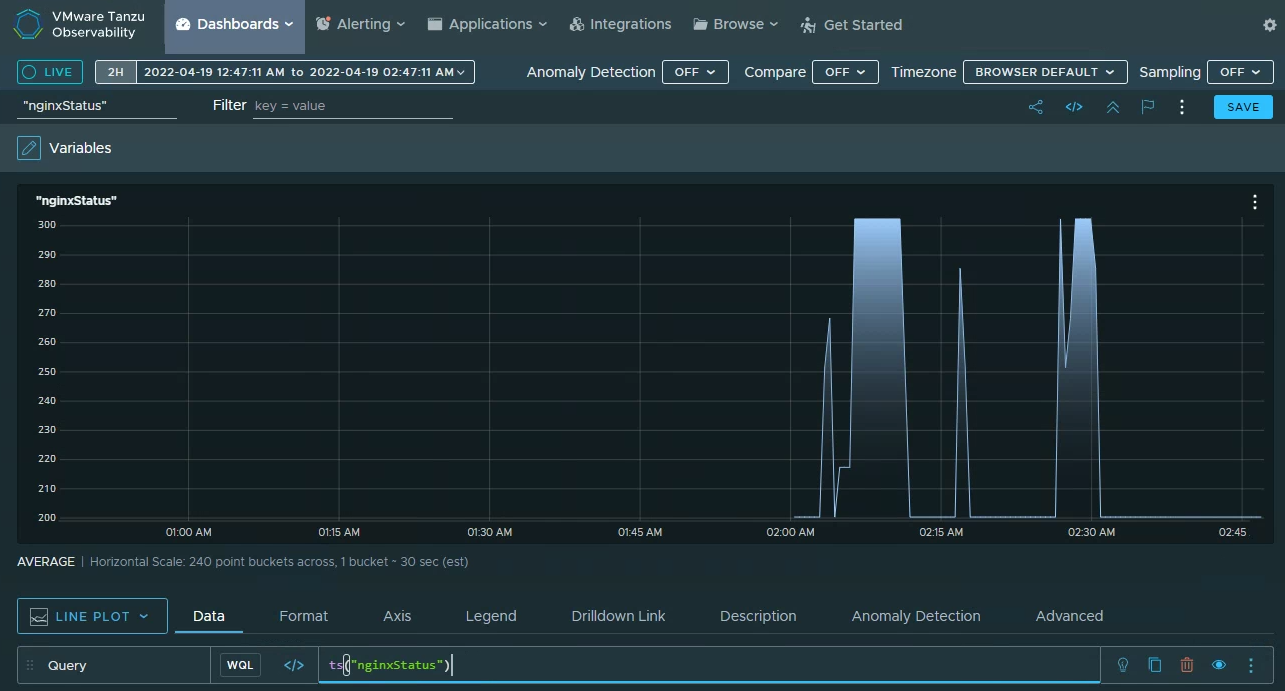
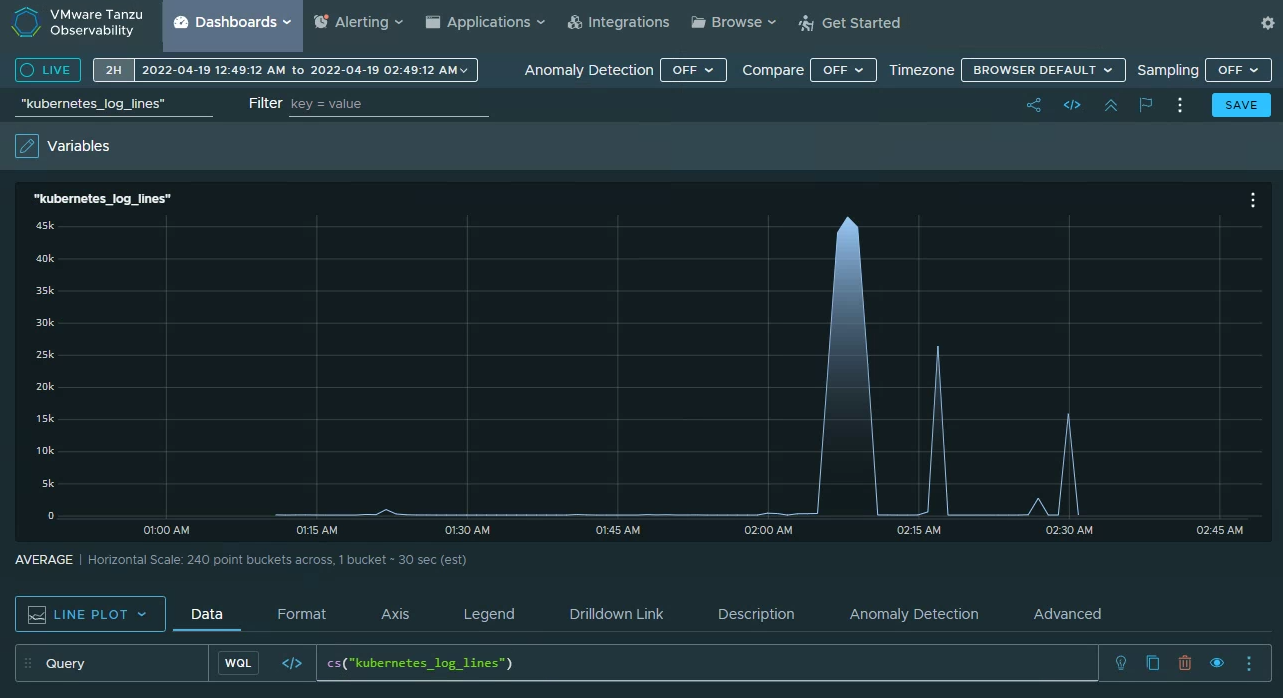
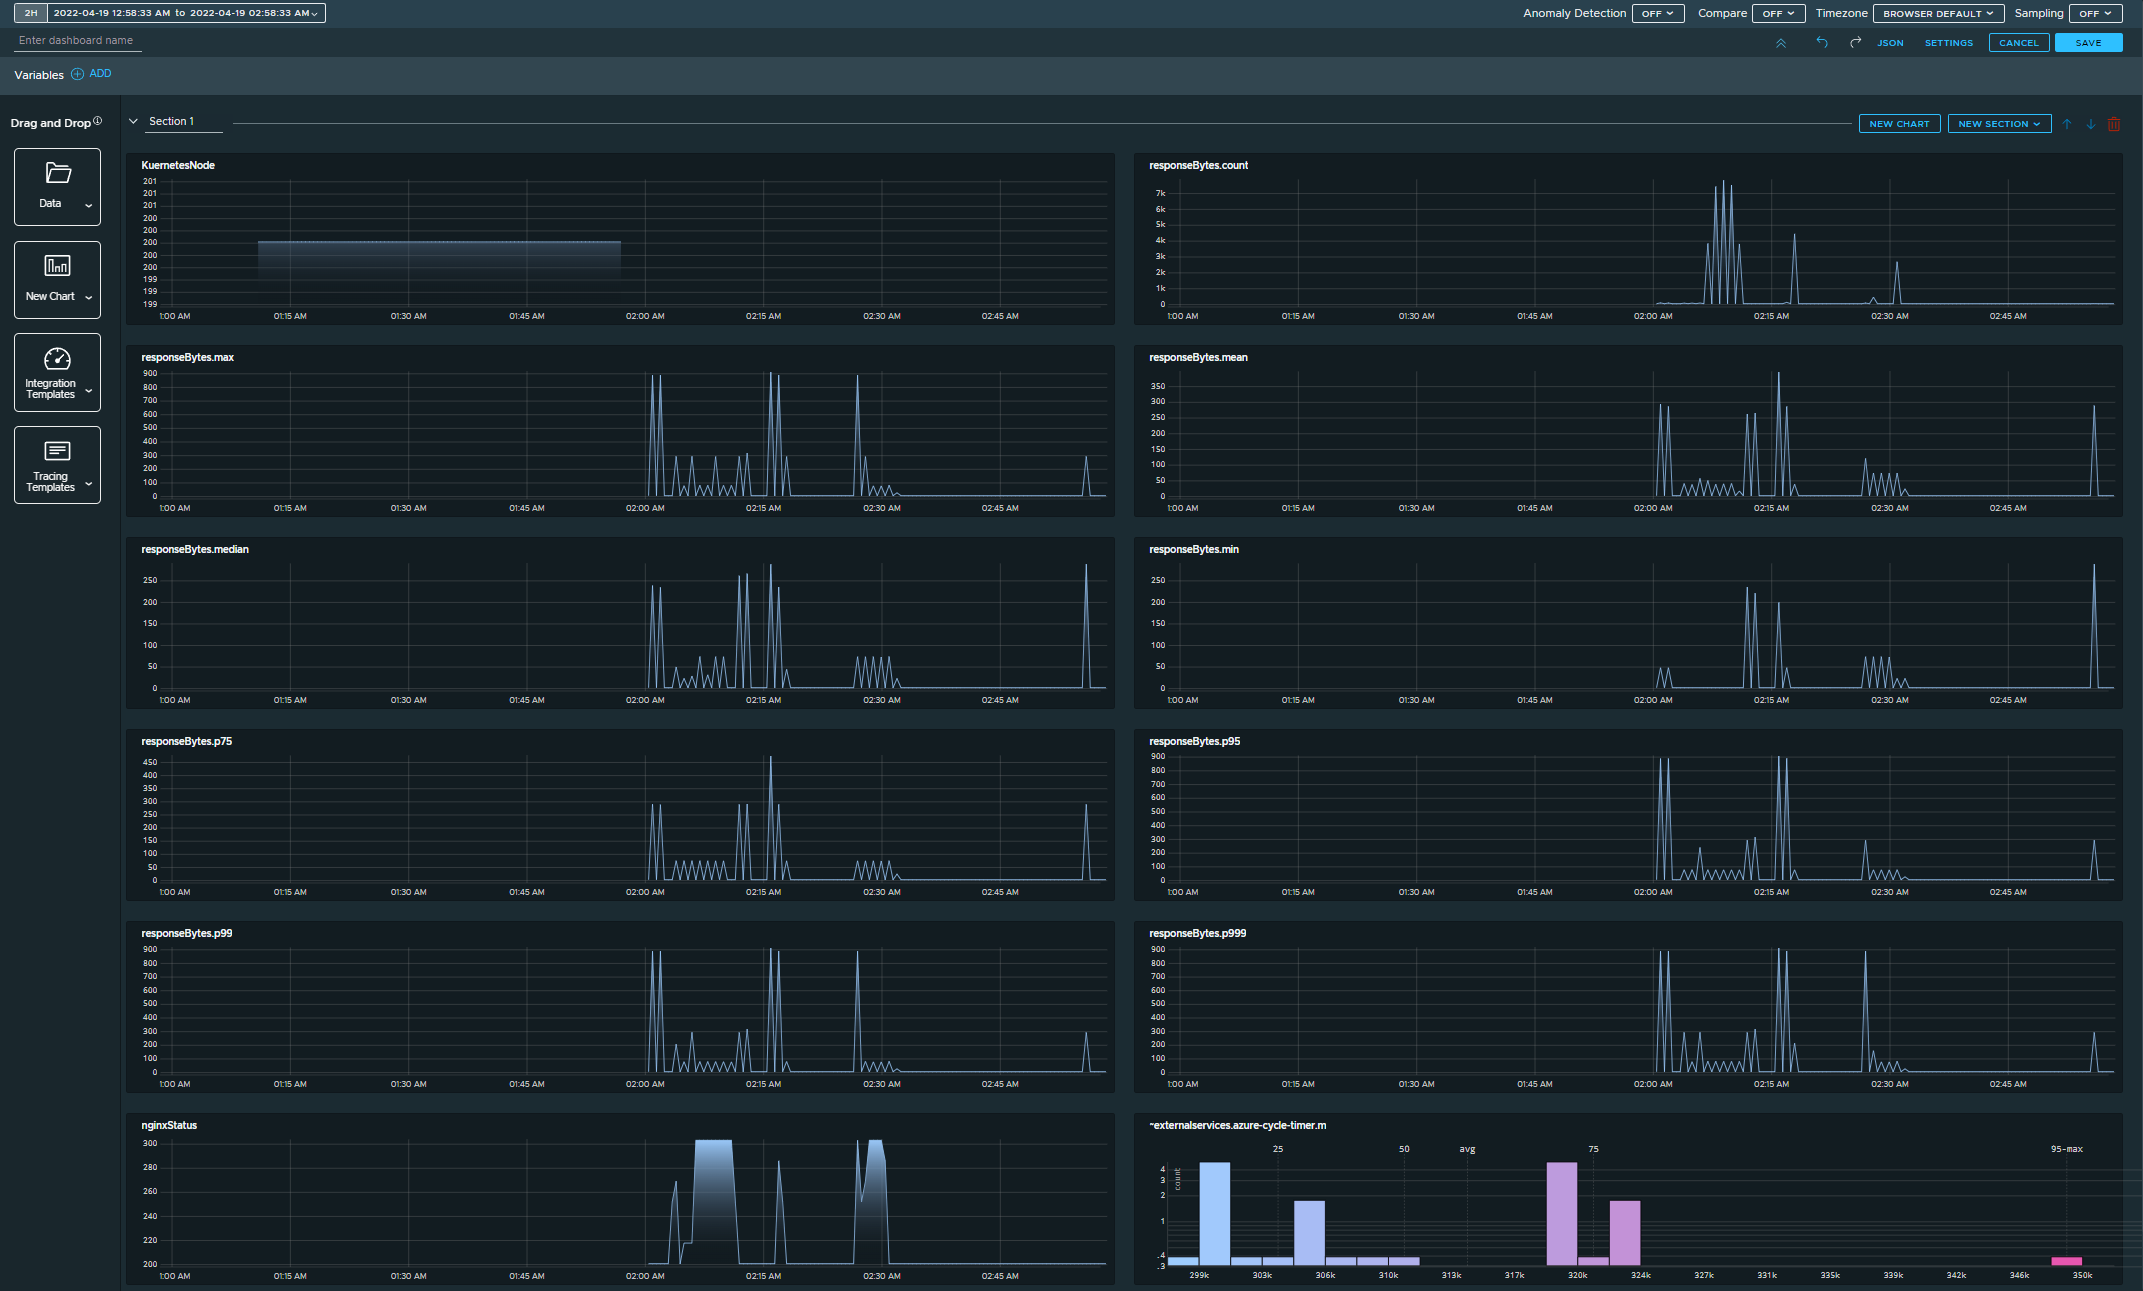
-
만들어진 chart를 조합하여 Dashboard를 생성할 수 있음.
댓글남기기